![]()
![]()
![]()
![]()
Glycomics in the hepatopathy
Liver fibrosis represents a wound healing response to virtually all forms of chronic liver injury, which is a reversible scarring response. However, uncontrolled liver fibrosis may lead to cirrhosis, which represents a major healthcare issue worldwide. Patients with liver cirrhosis are predisposed and at a higher risk for the development of hepatic carcinoma, and this process occurs in almost all patients with chronic liver injury. Damaged hepatocytes produce several mediators including reactive oxygen species and brogenic cytokines, which induce the activation and proliferation of hepatic stellate cells (HSCs) and other fibrogenic cells. Activated HSCs lose the potential to store intracellular vitamin A, up-regulate the expression of cytoskeletal protein alpha-smooth muscle actin ( α -SMA), increase the activity of DNA synthesis, and contain abundant rough endoplasmic reticulum (ER). Excess extracellular matrix (ECM) is produced in activated HSCs (in particular collagen types 1 and 3) in fibrotic liver and is coupled with the overexpression of other glycoproteins such as fibronectin, laminin, merosin, tenascin, nidogen, and hyaluronic acid.
Protein glycosylation plays an important role in the pathogenesis and progression of various liver diseases. Carbohydrate moieties on glycoproteins also play roles in intercellular contact and communication, which are important aspects of host immunity and are related to the development of cancer. The liver contains various receptors on sinusoidal and hepatocyte surfaces, and many proteins that bind to these receptors rely on carbohydrate moieties during the develop- ment of various chronic liver diseases.Changes in glycosylation of proteins associated with liver fibrosis received an increased attention. It demonstrated that increases in serum hyaluronan levels might be a marker of fibrosis in chronic viral hepatitis C. The result of Mehta et al. showed that the increased fucose binding lectin AAL (Aleuria Aurantia Lectin) reacted with fucosylated agalacto IgG was observed in patients with stage III or greater fibrosis and appeared to be correlated with the degree of fibrosis. Using DSA-FACE, Vanderschaeghe et al. have observed the ratio of two N-glycans: bisecting GlcNAc-modified agalacto glycan and triantennary glycan correlated with the histological fibrosis stage equally well as FibroTest which is used in the clinic today. Recently, our lab has used lectin arrays and lectin histochemistry to investigate the alteration of protein glycosylation in the activated HSCs (LX-2) compared with the quiescent HSCs. Our findings revealed that 14 lectins showed increased signal while 7 lectins showed decreased signal in the activated LX-2, which was induced by transforming growth factor- β 1 (TGF- β 1) compared with the quiescent LX-2.
Mouse models of hepatic fibrosis and high-throughput techniques are needed to perform a thorough analysis of this complex phenomenon, including techniques such as gene microarrays and lectin microarrays. The lectin microarrays contain a collection of mostly plant-derived carbohydrate binding proteins that are immobilized onto a solid support at a high spatial density. Interrogation of these arrays with fiuorescently labeled samples creates a pattern of binding that is dependent upon the carbohydrate structures present in the system and provides a method for the rapid characterization of carbohydrates on glycoproteins, bacteria, or mammalian cells.The lectin microarrays do not require the separation of N or O- linked glycans before analysis or the removal of sialic acids or other substructural motifs that might impede analysis by mass spectrometry. In this study, hepatic fibrosis animal models were constructed and used to investigate the differential expression profiles of glycan-related genes and the glycan structure profile by gene expression and lectin microarrays, in an effort to understand a mechanism of control of the glycan code in animal models of hepatic fibrosis.
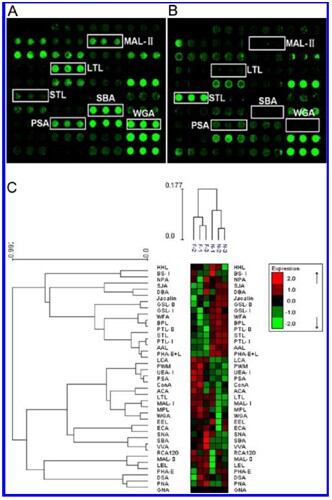
Glycan profiling offibrotic and normal reference livers using lectin microarrays.
Scanned images were derived by analysis of the ?brotic (A) and normal reference livers (B). The significantly altered lectins (WGA, PSA, MAL-II, LTL, SBA, and STL) are marked (C). Heat map and hierarchical clustering of the 37 lectins. Glycan profiles of fibrotic samples (F1, F2 and F3) and their normal reference (N) were clustered (average linkage, correlation similarity). Samples are listed in columns and the lectins are listed in rows. Data are given as median values centered in the row dimension, and the color and intensity of each square indicates expression levels relative to other data in the row. Red, high; green, low; black, medium.
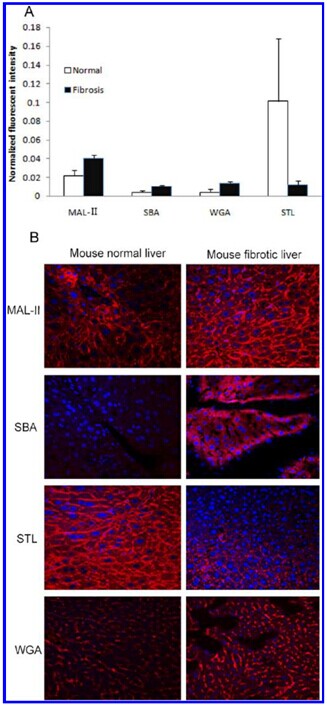
Glycans with significantly altered expression in the ?brotic liver compared to the normal reference.
(A) Normalized fluorescence intensity of lectins with altered signals in the lectin microarray (F/N ratio >1.5 or <0.6). (B) Liver paratern sections were stained with Cy3- labeled lectins (MAL-II, SBA, STL, and WGA) at a concentration of 1 mg/mL. The images were acquired at the same exposure time for each lectin.